Creating a Wiretap
In this guide we will create a Wiretap to monitor the Cloudevent traffic happening within our bridge.
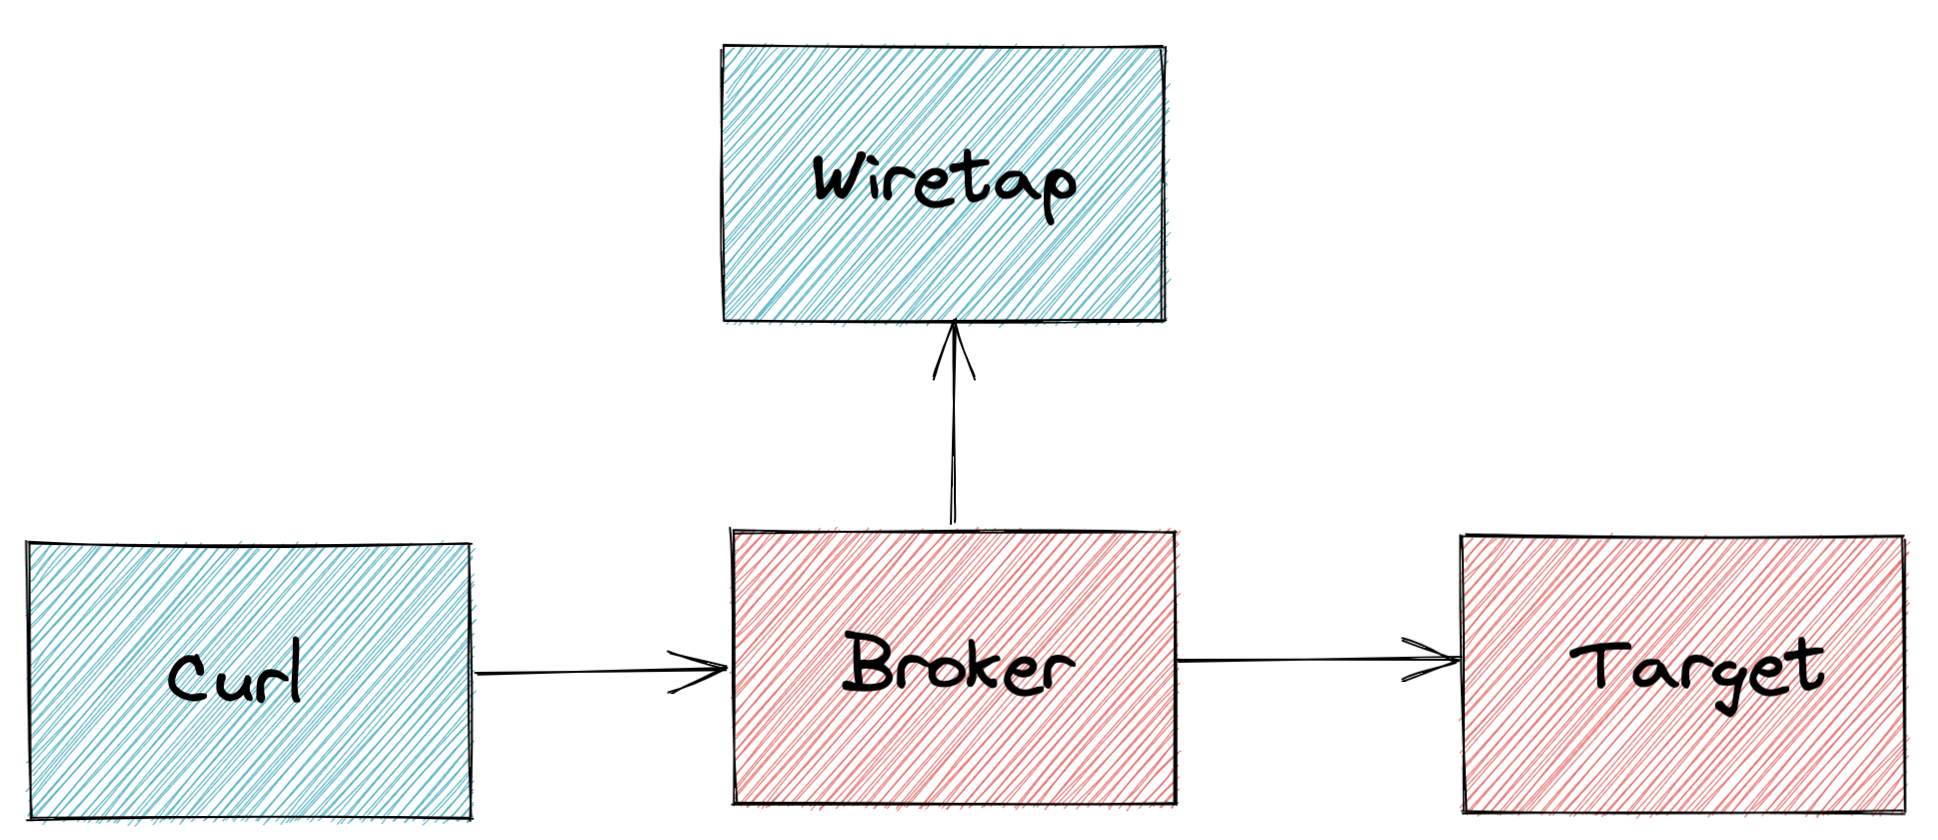
What is a Wiretap?
A Wiretap is a powerful debugging tool/methodology that can be used to understand the flow of events through the system by subscribing to all of the events that pass through the associated Broker. This is accomplished by the use of a Trigger to route all of the events into a logging service.
Consider the following illustration:
Implementing a Wiretap
Creating an Example Bridge
Lets consider this example Bridge as a starting point. This example is currently configured with a PingSource and a Broker.
apiVersion: eventing.knative.dev/v1
kind: Broker
metadata:
  name: events

---

apiVersion: sources.knative.dev/v1
kind: PingSource
metadata:
  name: ping-sockeye
spec:
  data: '{"name": "triggermesh"}'
  schedule: "*/1 * * * *"
  sink:
    ref:
      apiVersion: eventing.knative.dev/v1
      kind: Broker
      name: events
Implement a Wiretap
Now that we have a bridge to work with, lets go ahead and modify our manifest to include a Wiretap. We can do this by adding a Trigger and a Service to our manifest. The Service we will be using will be using is called Sockeye, this is a simple web application that will log the events it receives.
We can accomplish this by adding the following to the manifest under the PingSource object:
apiVersion: eventing.knative.dev/v1
kind: Trigger
metadata:
  name: sockeye
spec:
  broker: events
  subscriber:
    ref:
      apiVersion: serving.knative.dev/v1
      kind: Service
      name: sockeye

---

apiVersion: serving.knative.dev/v1
kind: Service
metadata:
  name: sockeye
spec:
  template:
    spec:
      containers:
        - image: docker.io/n3wscott/sockeye:v0.7.0@sha256:e603d8494eeacce966e57f8f508e4c4f6bebc71d095e3f5a0a1abaf42c5f0e48
Using the Wiretap
Now that we have all the parts in place, we can utilize our Wiretap to monitor the events that are being sent through our bridge by the PingSource Object. We can do this in two ways.
- View the pod logs of the
sockeyeservice: kubectl get podswill show the pods that are running. Retrieve the sockeye pod name from the output.-
kubectl logs <SOCKEYE_POD_NAME> user-containerBy replacing the<SOCKEYE_POD_NAME>with the pod name you can view the logs of the sockeye pod. -
View the web service exposed by the
sockeyeservice: kubectl get ksvcwill show the KSVC's that are running. Retrieve the sockeye public URL from theURLcolumn and navigate to it in your browser.